One click from a clinical cohort to a research draft. Room to explore the whole way. It reads the data, understands the disease, surfaces what matters and carries it through. Step inside anywhere to follow a finding, change the question, and find the next one.
A clinician-native research workspace for real-world clinical data.
Coded columns, value legends jammed into headers, sentinels, mixed languages. DataStoryMD maps every column to clinical meaning before it models anything.
Named, correctly typed, modeled, and written up in a sentence a clinician can read aloud.
Most research tools begin after the hard part — once someone has framed the question, chosen the outcome, cleaned the columns and picked the test. This one begins at the file, and lets the thinking go wherever it goes. Everything underneath applies the same rules either way — and says which findings were exploratory rather than pre-specified.
Starting this easily usually costs you depth — that is the trade every simple tool makes. Here you get both.
Dozens of related results collapse into a handful of clinical themes, each scored and ready to open. Overview first, detail when you ask for it — so the pattern recognition you already have gets something to act on, instead of a table to grind through.
Counts from the bundled 300-patient simulated cohort. TCGA-OV, with 28 mapped clinical fields, tests 19.
Then keep going: the pathway map, cohort comparison, and live subgroup drill-down are built to be explored, not screenshotted. See them in the live demo →
The interaction model is not a design preference. It follows established results on how people actually investigate data — including two controlled experiments that bear directly on what this product is for.
Adding 500 ms of latency to exploratory analysis measurably reduced how much of the data people covered, how many observations and generalisations they made, and how many hypotheses they formed. Delay does not just annoy — it suppresses discovery.
A visual interactive tool for clinical research produced hypotheses faster — and rated lower on feasibility and quality. Removing friction without keeping the methodology honest buys volume at the cost of worth.
Those two experiments are the argument for this product in one line: speed changes how much you find, and guardrails decide whether it was worth finding. That is why both are built in, and why neither is optional. What these results establish is the design; whether this product improves research outcomes is a question we intend to measure, not one we claim answered.
Everything that has to happen for a cohort to become a finding, and which side of the screen it happens on. The machinery takes the preparation, the scanning and the bookkeeping. The judgement never leaves your hands.
Reads the file as it is. Profiles every field, maps local names and codes, resolves units, missingness and repeated measures into clinical concepts.
Confirm anything ambiguous. You start from your dataset — not from a specification you had to write about it first.
Builds the overview — variables, outcomes, timelines and cohort structure — before any single model takes over the screen.
Notice what is interesting. Patterns, gaps and distributions, in the context that makes them mean something.
Scans broadly, behind gates: associations, subgroups, survival, thresholds, interactions, trajectories — and only where the design permits the question.
Decide what deserves attention. Whether a result is clinically plausible, and whether it matters, stays a human judgement.
Recomputes without rebuilding. The filter, the focal variable, the outcome and the adjustment set all stay attached to the same analysis.
Test the idea directly. Split it, compare, drill down, change what it adjusts for, challenge the explanation you were given.
Keeps the context. A finding stays linked to its methods, assumptions and evidence instead of becoming a screenshot in a folder.
Turn one observation into the next question — while everything you built to get there is still standing.
Assembles methods, results and figures from the same analytical record you just explored, so the write-up matches what was actually run.
Interpret, edit, conclude. It accelerates the writing. The science, and the authorship, remain yours.
The left column makes statistical decisions and states every one of them — which model, which adjustment set, what it refused and why. What it does not do is decide whether a result is clinically plausible, or what it means — and the second kind is the reason you were the one looking at this cohort in the first place.
Every finding opens. Cut the cohort, split it, adjust it, follow it somewhere else — and the next question is already sitting there. No request, no queue, no one to ask.
Every control above is in the live demo, and every number is one the engine produced on the bundled 300-patient cohort. The same adjustment sets, multiplicity correction and time-order rules apply whichever way you got here, so a question you followed on impulse is held to the same standard as the one you planned — and is labelled exploratory when it is.
The parts a findings list can't give you.
Type a clinical question and get a real answer with the statistics behind it. No query language, no pivot tables.
One click to a formatted Word or PowerPoint document, figures, methods, and citations included.
Each specialty pack encodes the causal structure, temporal order, confounders, valid endpoints, and the traps. The statistical judgment is built in, so your clinical expertise is all it takes to run rigorous research.
Any tool can surface a correlation. The harder question is which associations reflect biology and which are artifacts of how the data was collected.
On this cohort it set aside 67 outcome candidates as ineligible and excluded hundreds of biased comparisons, each with a stated reason.
Deterministic by design. The same data and the same rules produce the same analysis, from a fixed statistical engine rather than a language model.
Every result is traceable — the estimate, its uncertainty, what it was adjusted for, and the decisions behind it.
More treatment lines means the patient lived long enough to receive them. Survival drives the count, not the reverse.
The vocabulary, the chronology, the endpoints, the confounders and the literature all live in a domain pack the engine reads — so a specialty is something it can be taught. Depth differs by pack, and we say which is which.
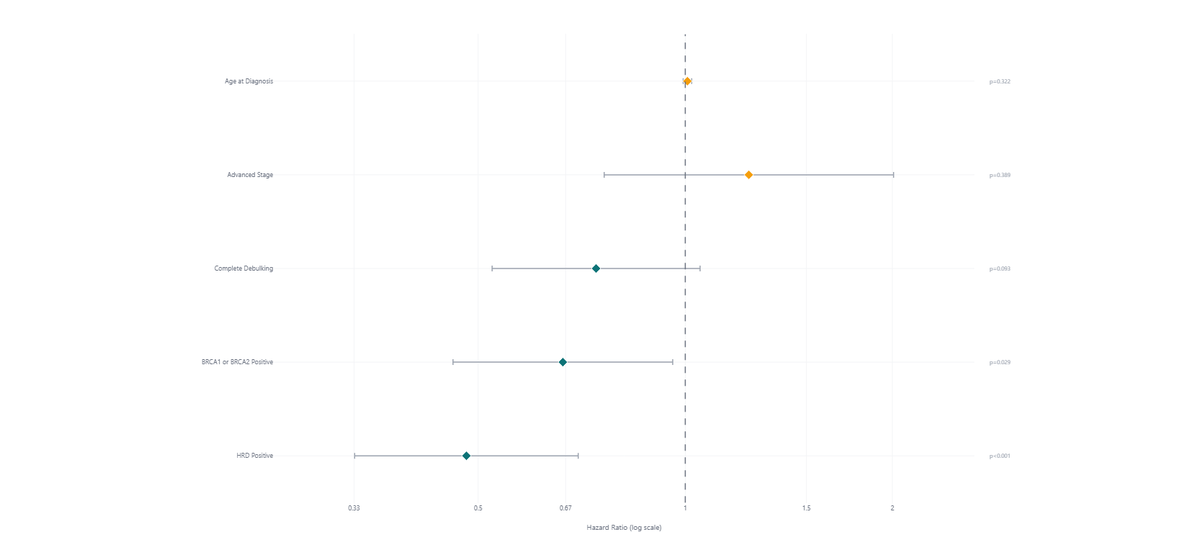
Survival, HRD and BRCA, platinum sensitivity, debulking — and it reproduces the published TCGA-OV literature, quantity for quantity.
Trimester uterine- and umbilical-artery Doppler, sFlt-1/PlGF, pre-eclampsia and growth-restriction screening — the engine reads real-world windowed columns automatically. In active clinical validation before it goes public.
Name your field’s concepts, endpoints and timelines once. The same engine then handles the messy data, the adjusted models and the caveats — on your specialty.
So we ran it on public cohorts whose results are already in the literature, and checked every number we could — against the peer-reviewed paper and the consortium that analysed those exact patients.
Read the full validation report →
What you open is what we checked. The demo carries this exact 316-patient cohort — the same patients Birkbak et al. analysed, and the same file these hazard ratios were reproduced on. Like for like, no larger-export caveat.
Sources: Hosmer & Lemeshow, Applied Logistic Regression 2nd ed. · Birkbak et al., PLoS One 2013;8(11):e80023 · TCGA Research Network, Nature 2011;474:609–615. Based upon data generated by the TCGA Research Network.
No signup, no upload. Three cohorts are waiting inside — a simulated ovarian cohort with every field populated and the ground truth known, the real TCGA-OV patients the hazard ratios above were computed on, and a simulated obstetric cohort. Pick one and it runs in about fifteen seconds.
Private beta. Your data never leaves your machine — the tool runs locally and the analysis is offline.
Install, point it at a spreadsheet, and read the findings. Ten minutes end to end.
Best on a laptop or desktop. The analysis workspace uses wide tables, survival curves and a pathway map, so on a phone this page reads fine, but the tool itself wants a bigger screen.